Executive Project Controls Dashboard
Turning fragmented cost, schedule, change, RFI, and contingency data into an executive early-warning view.
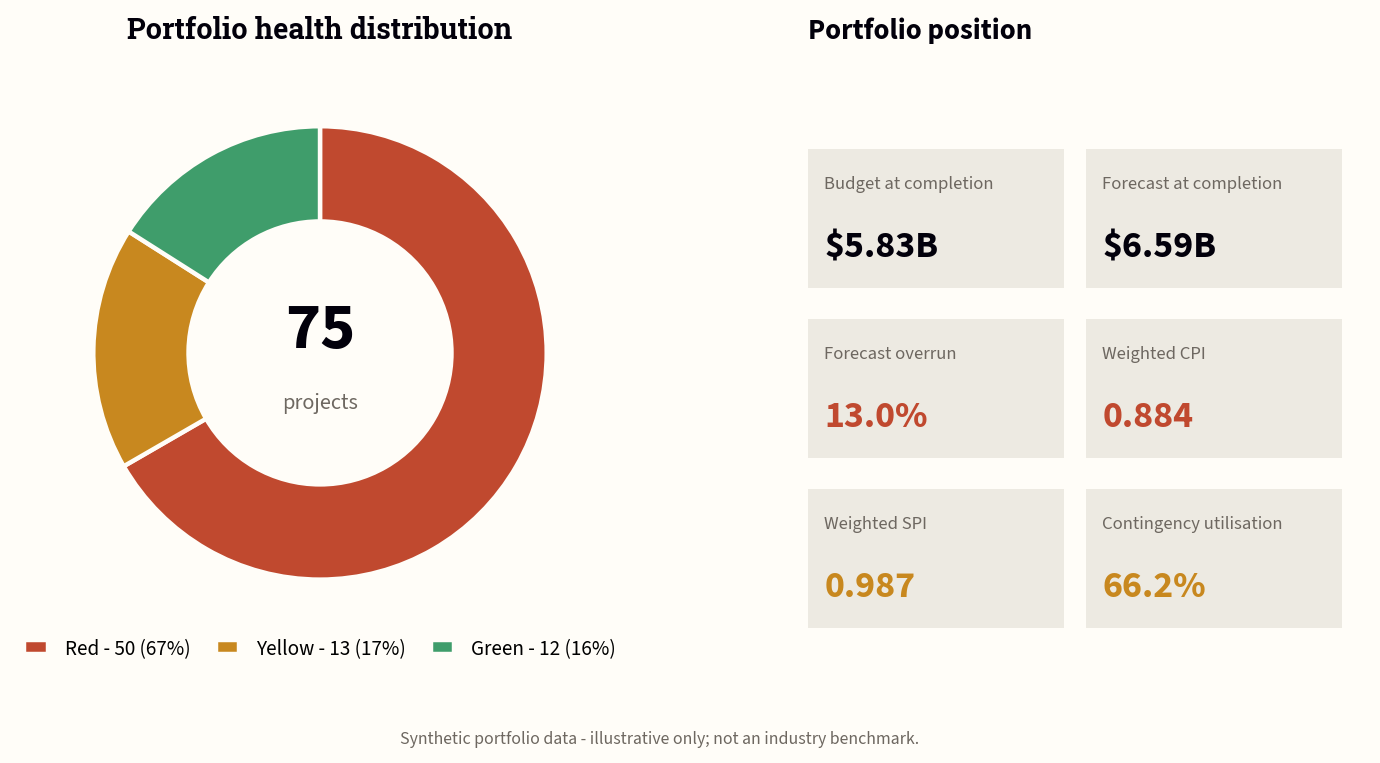
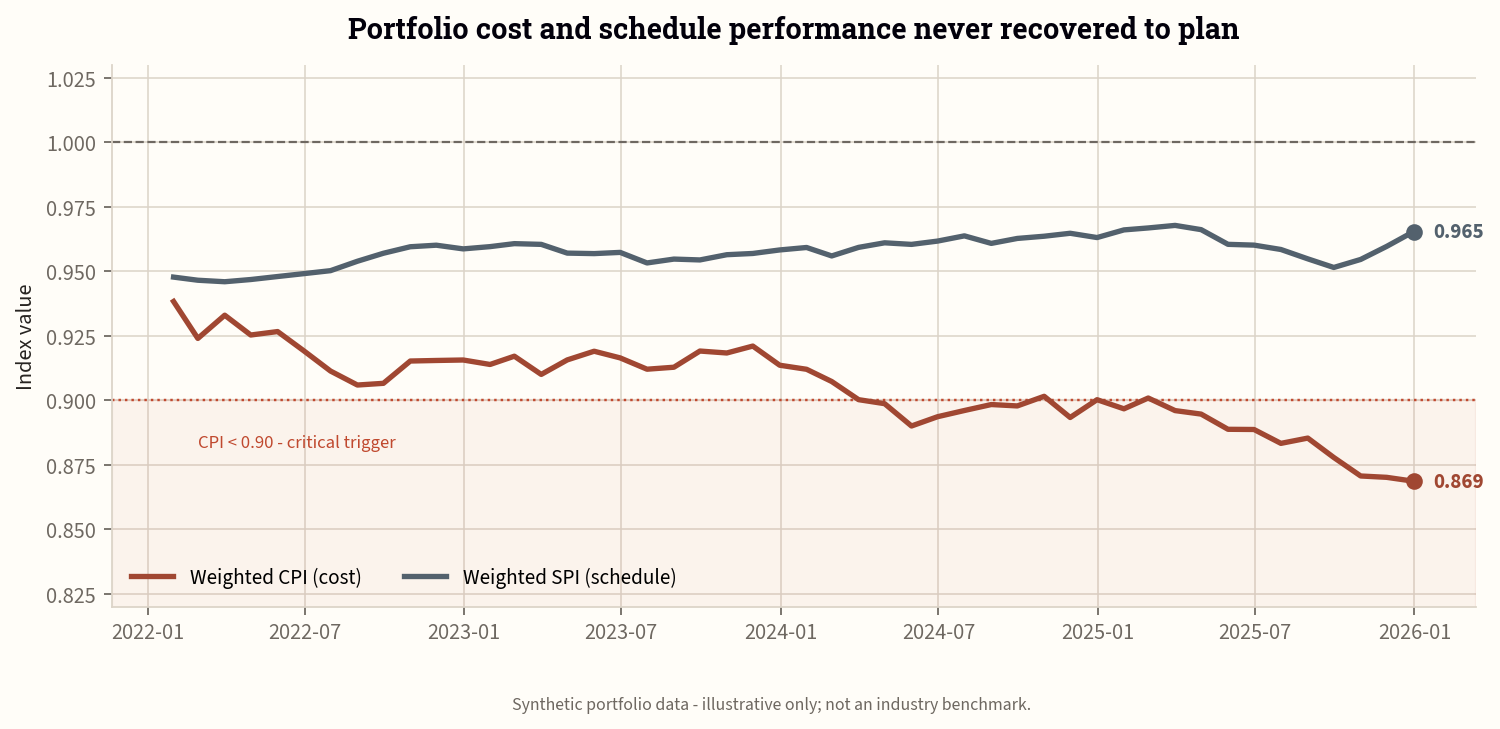
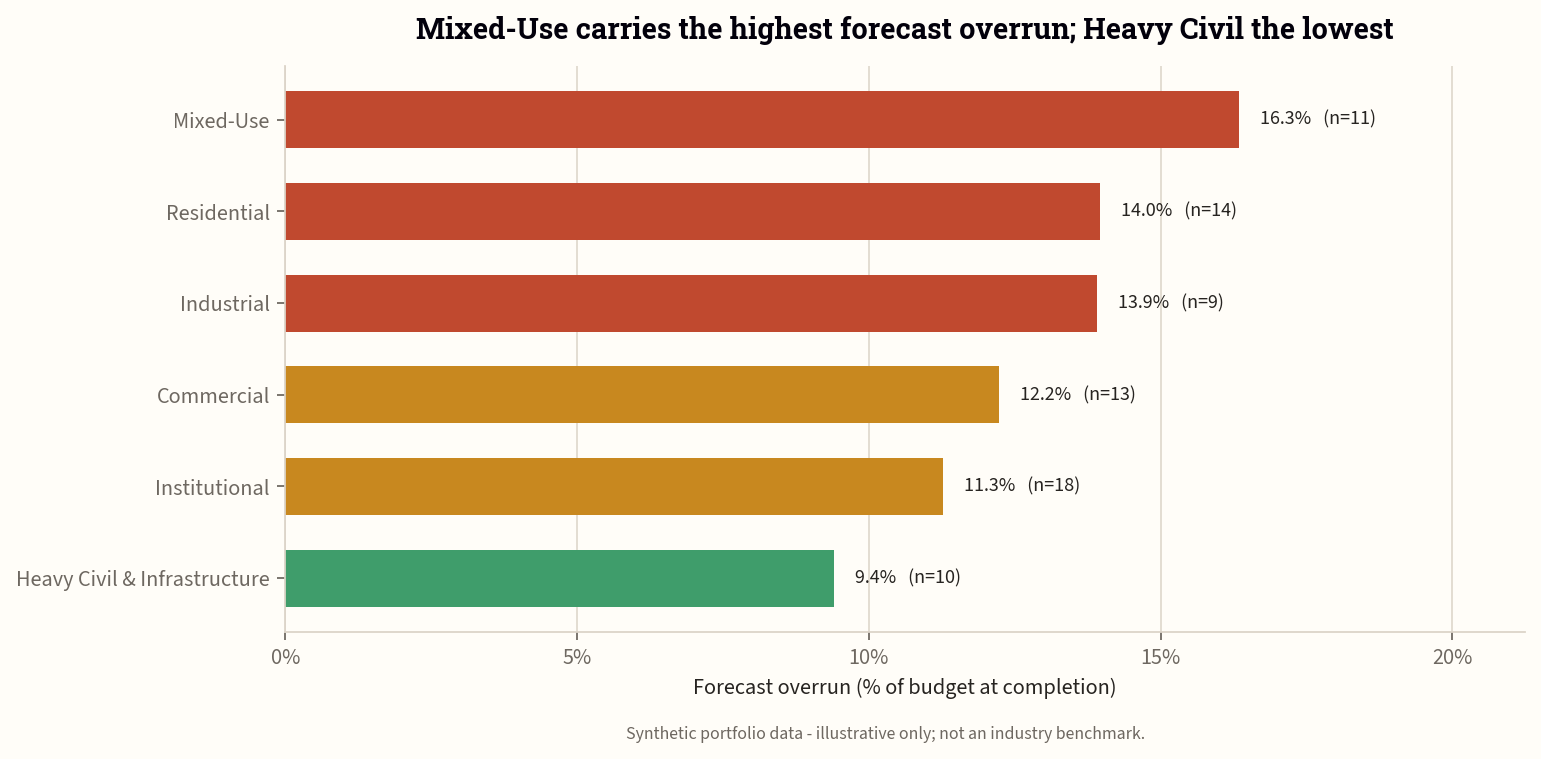
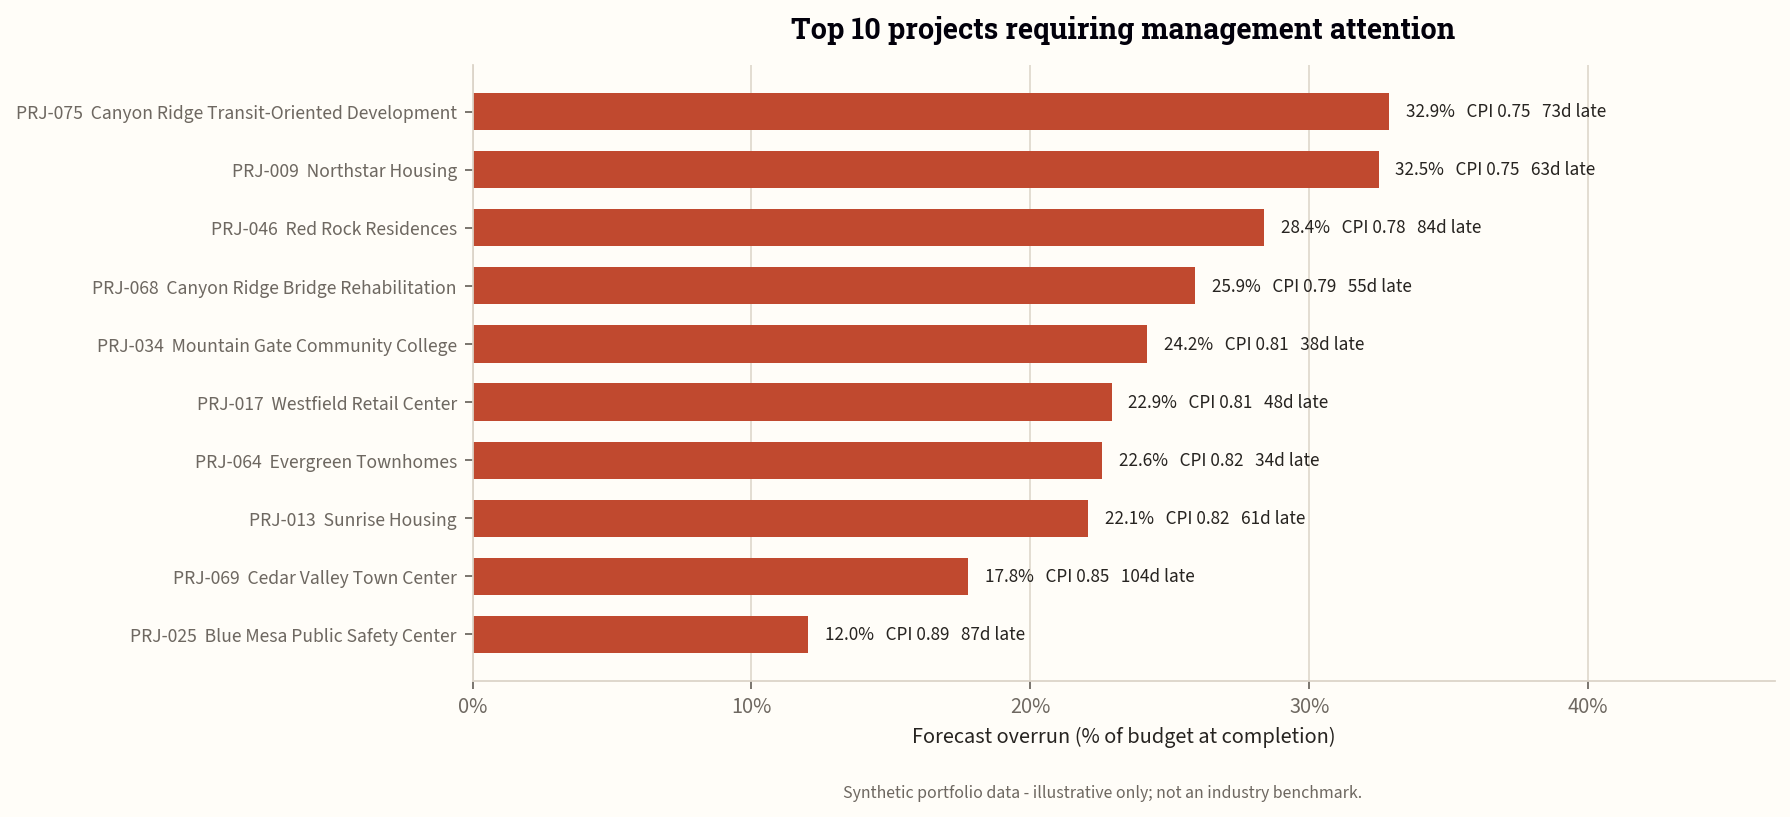
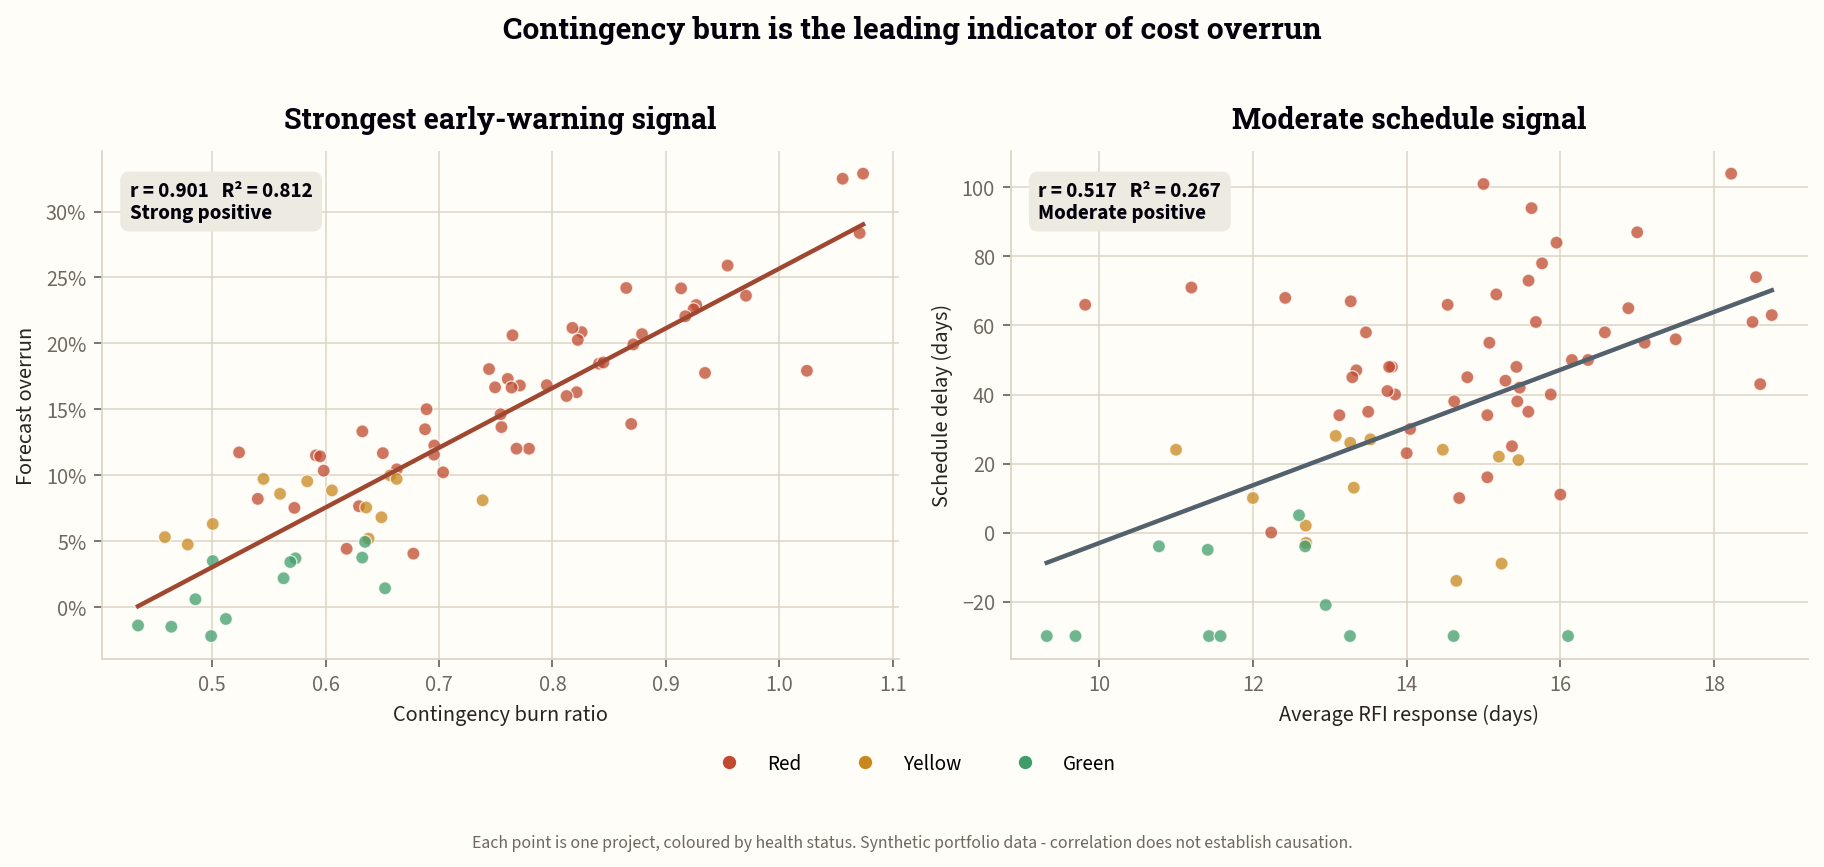
In Project LLC developed this synthetic demonstration to show how construction organizations can consolidate project-control data, identify deteriorating projects, and communicate portfolio exposure through transparent metrics and visual reporting.
CPI, SPI, CV, SV, EAC, VAC, forecast overrun, and completion-date variance.
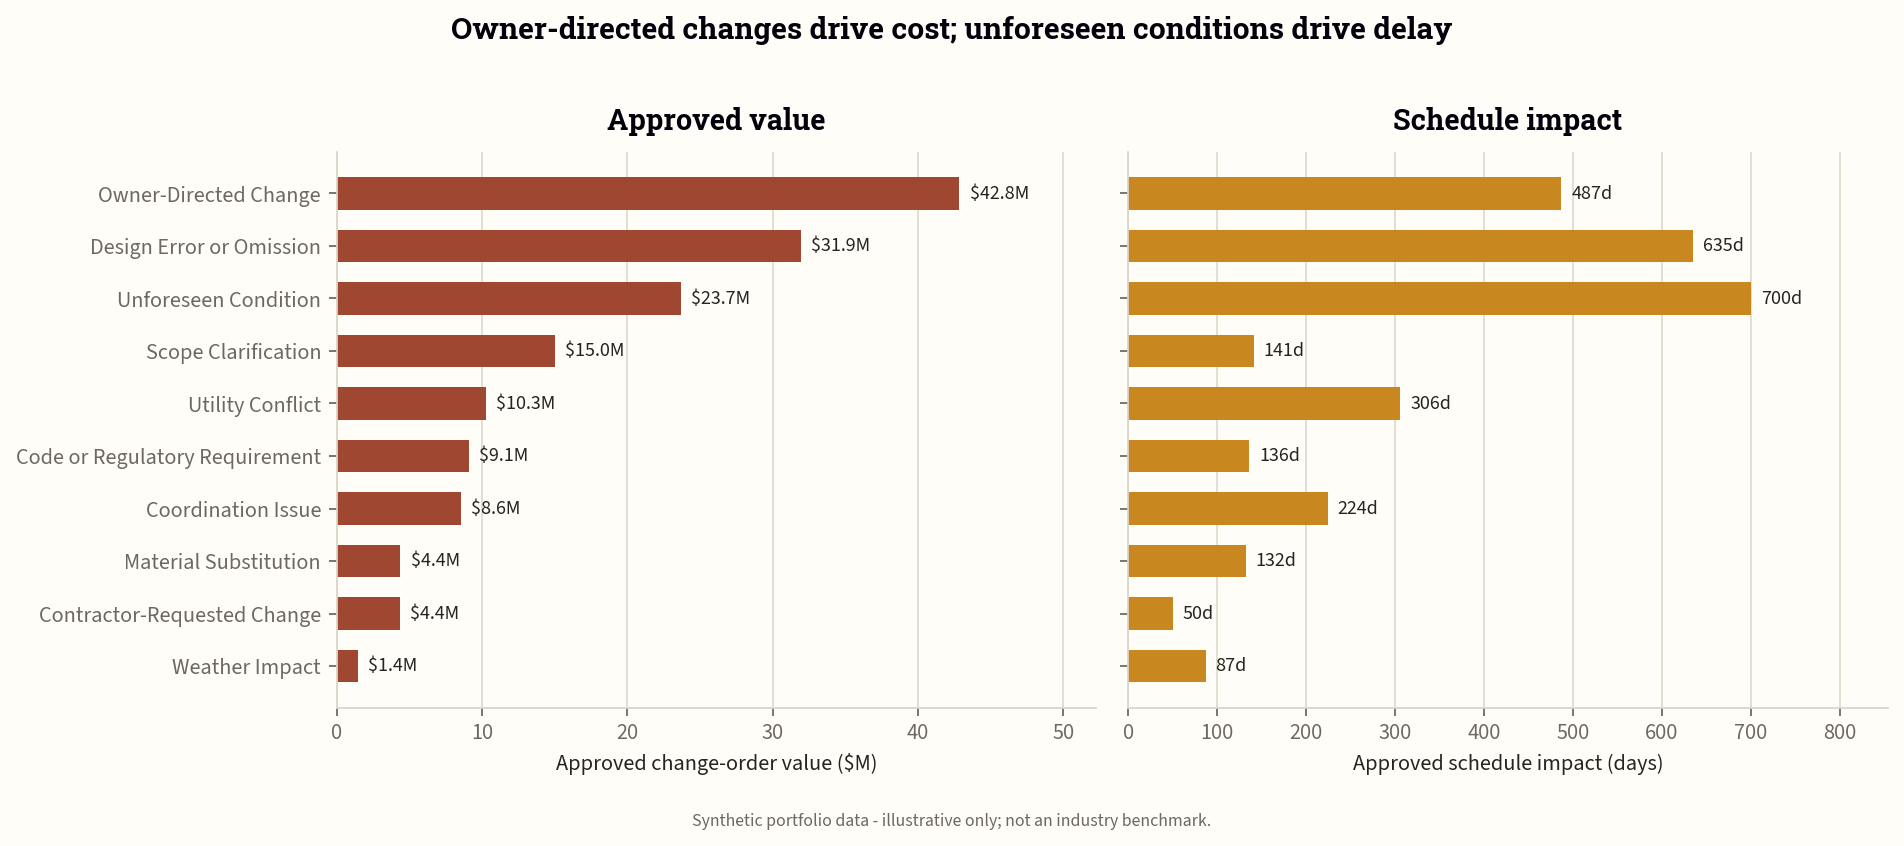
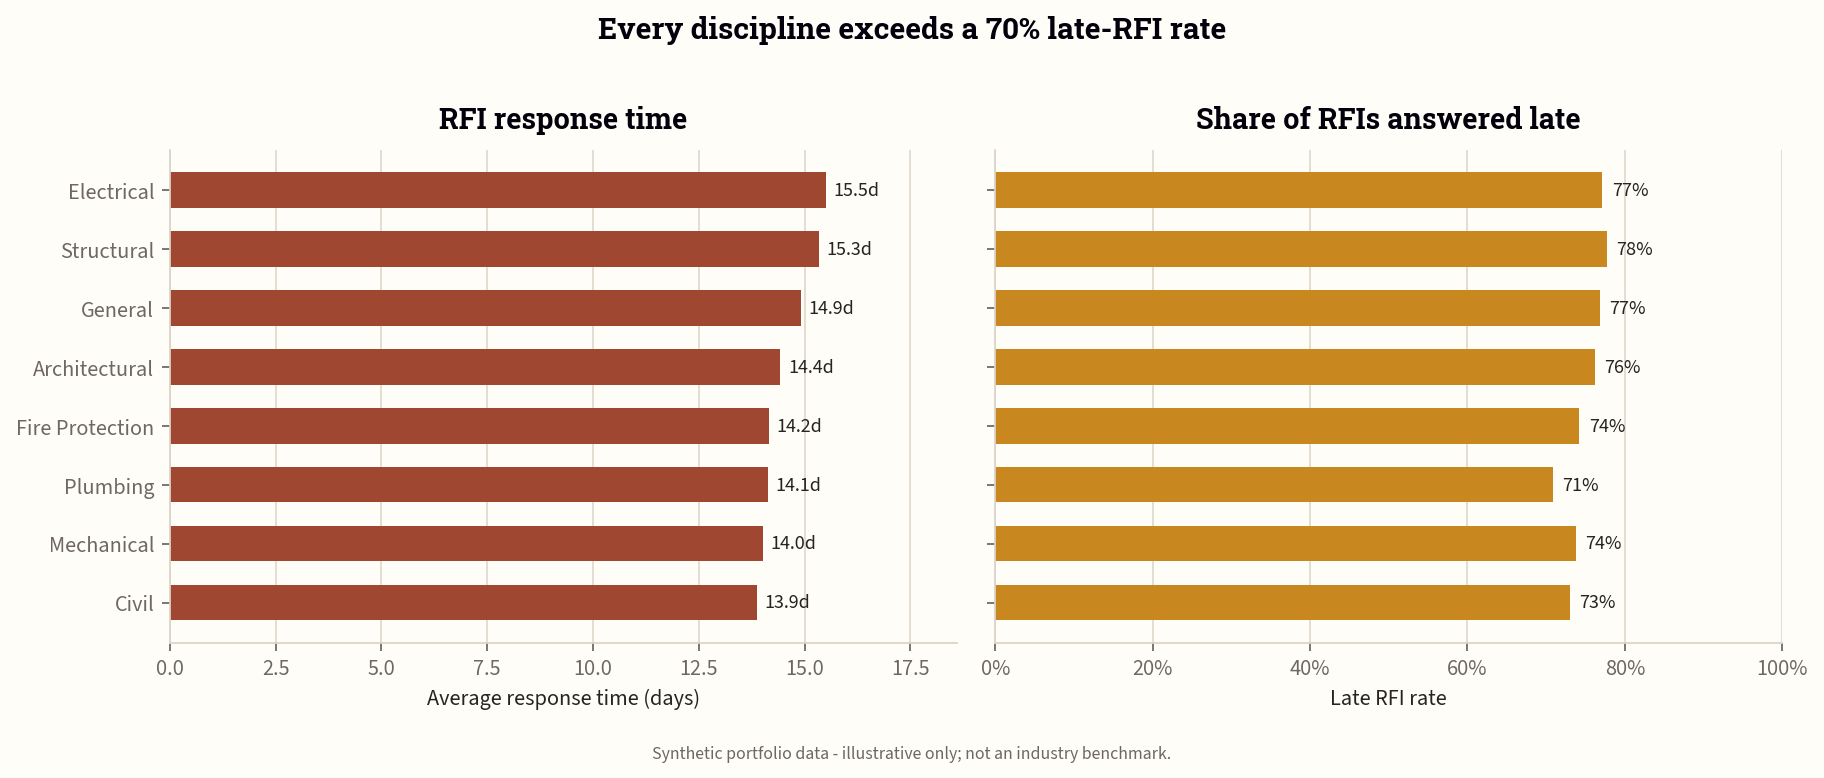
Cause segmentation, approval cycles, response time, backlog, and cost/schedule impact.
Transparent Green, Yellow, and Red thresholds for management attention.
Decision-focused dashboards, concise narratives, and drill-down-ready analytical data.