Construction Project Controls Analytics

Which project-controls metrics move first — early enough to intervene? An end-to-end analysis of cost and schedule performance across a 75-project, $5.83B portfolio.

Data disclosure: every record is synthetic. Projects, clients and personnel are fictional. Nothing here represents actual client performance or verified industry benchmarks.

Portfolio position

48 months of earned-value data, change orders and RFI logs across 75 projects.

Budget at completion
$5.83B
Forecast at completion
$6.59B
Forecast overrun
13.0%
Weighted CPI
0.884
Average delay
33.7 days
Projects at Red
50 of 75
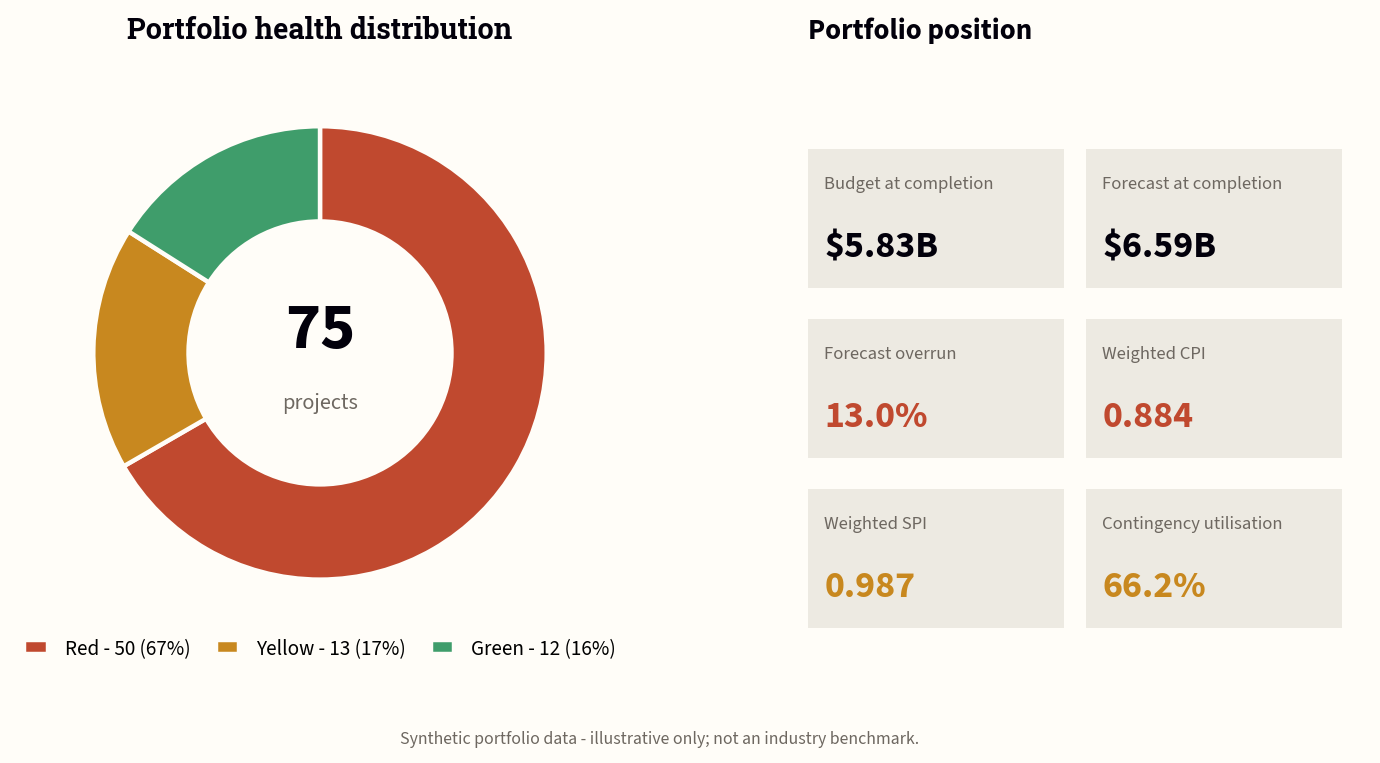
Portfolio health distribution and key performance indicators
Two-thirds of the portfolio sits at Red status, with a forecast overrun of $755.6M.

What the analysis found

Five results that shaped the recommendations.
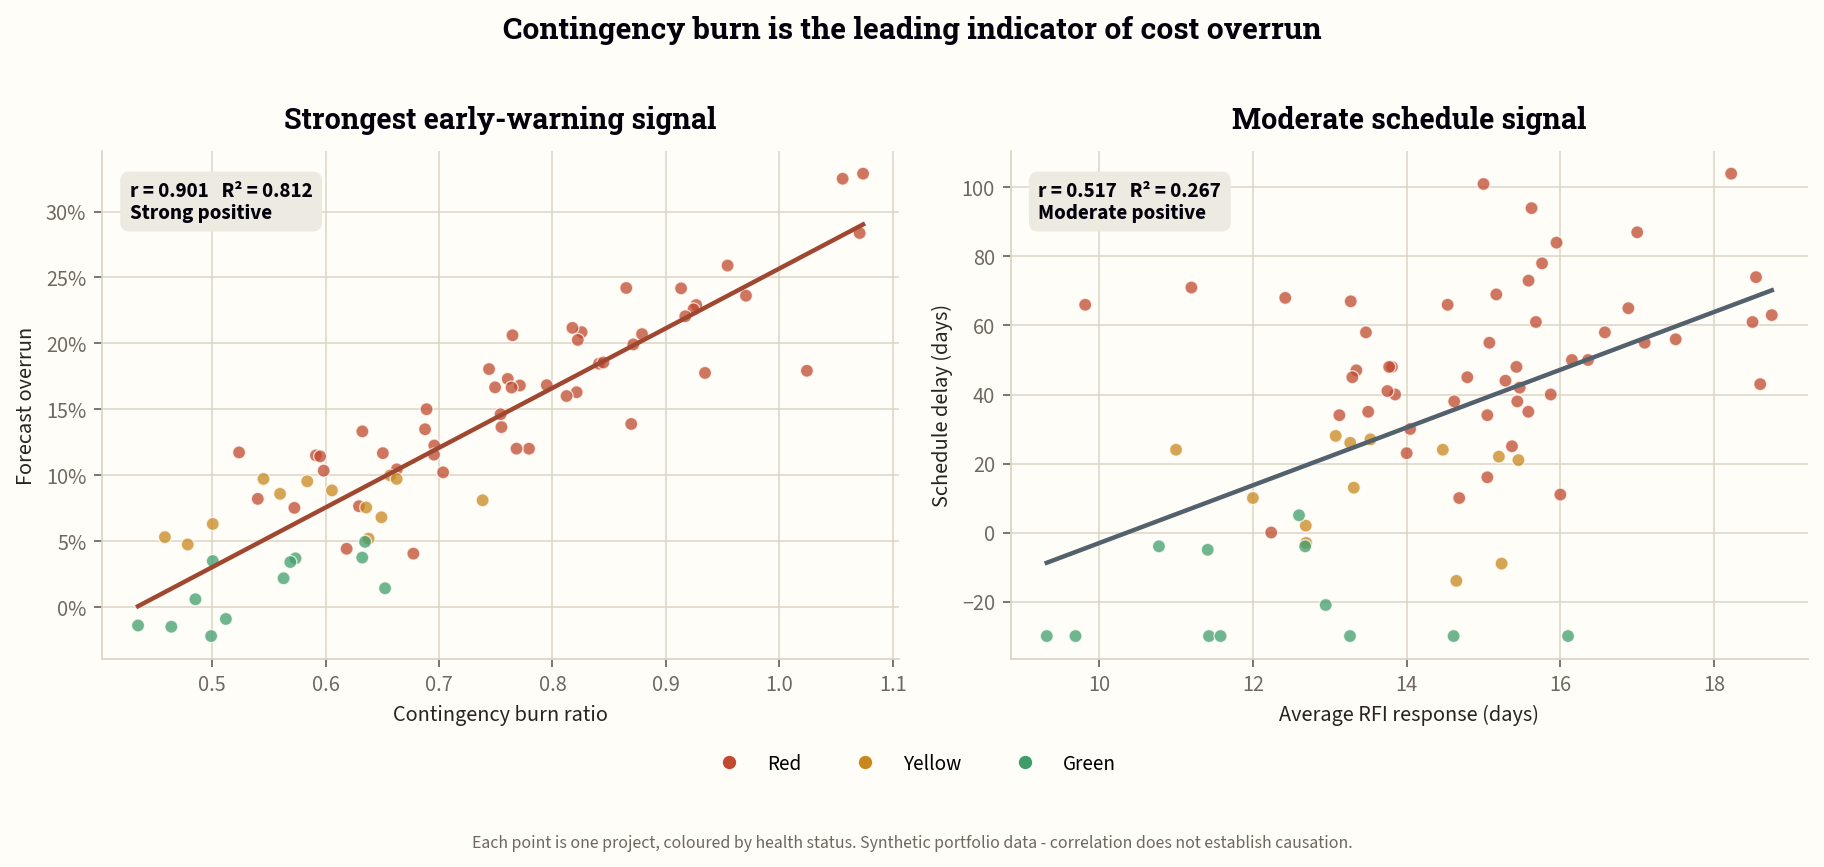
Contingency burn ratio is the strongest early-warning signal. It explains 81% of the variance in forecast overrun (r = 0.901) and is measurable from month one — well before CPI crosses a reporting threshold.
RFI turnaround matters; RFI volume does not. Response time correlates with schedule delay (r = 0.517), while RFI density does not (r = −0.058).
SPI hides lateness. Weighted SPI held near 1.00 throughout while average forecast delay reached 33.7 days — the index converges to 1.0 at completion regardless of how late a project finishes.
Cost and schedule risk come from different change-order causes. Owner-directed changes drive the most cost ($42.8M); unforeseen conditions drive the most delay (700 days).
Late RFIs are a systemic constraint. Every discipline answers more than 70% of RFIs late, clustered tightly at 13.9–15.5 days.
Scatter plots of contingency burn ratio against forecast overrun, and RFI response time against schedule delay
Contingency burn ratio against forecast overrun (left) and RFI response time against schedule delay (right). Correlation does not establish causation.

Explore

Full write-ups, source data and query code.